
September 15, 2026 · Dhiraj Bashyal
Data Science Projects: Beginner to Advanced Ideas That Make Your Resume Stand Out in 2026
On this page
Standing out in the modern tech hiring landscape requires proving you can turn messy datasets into business revenue, not just re-running tutorial code in isolated Jupyter notebooks. If you want hands-on training to build portfolio-ready models with live mentorship, explore our job-ready online IT courses at Commit Career.
What Makes a Data Science Project Worth Building?
Completing a simple tutorial or downloading a pre-cleaned dataset from a beginner competition is no longer enough to get noticed. A resume-worthy portfolio project must demonstrate the end-to-end analytical workflow that mirrors real enterprise operations, bridging raw data to executive decision-making. Reviewing foundational concepts of data science can help establish these baseline standards before writing code.
Business Problem Definition: Stating a concrete business question, financial bottleneck, or operational efficiency objective.
Data Collection and Preparation: Ingesting raw, unstructured, or multi-table relational data using SQL or web scraping pipelines.
Exploratory Data Analysis (EDA): Uncovering statistical relationships, distribution anomalies, and outlier distributions.
Statistical Reasoning: Applying hypothesis testing, variance evaluation, and correlation matrix analysis.
Feature Engineering: Constructing relevant variables, performing encoding techniques, and normalizing numerical values.
Machine Learning Modeling: Selecting, training, and tuning algorithms matched to data characteristics.
Model Evaluation: Measuring precision, recall, RMSE, or ROC-AUC rather than relying strictly on surface accuracy.
Visualization and Communication: Building interactive visual displays to translate output into non-technical language.
Actionable Conclusions: Providing measurable recommendations or deploying interactive REST APIs.
Beginner vs. Intermediate vs. Advanced Data Science Projects
Beginner Projects: Focus on clean, structured single-table datasets. The goal is mastering syntax, exploratory analysis, standard data visualizations, and basic regression or classification algorithms using Scikit-Learn.
Intermediate Projects: Introduce messy data, multiple relational tables, feature creation, time-series elements, and hyperparameter tuning. The focus shifts toward custom pipeline building and evaluating trade-offs between model accuracy and latency.
Advanced Projects: Emphasize real-world MLOps practices, streaming pipelines, cloud deployment, interactive web GUIs, vector databases, and containerization with Docker. These demonstrate production capabilities required for engineering roles.
What Makes a Data Science Project Strong for Job Applications
Problem-Solving Ability: Clear reasoning behind model choices, feature selection, and trade-off decisions.
Data Handling Depth: Facility with handling missing entries, imbalanced classes, and non-standard distributions.
Statistical Knowledge: Understanding probability distributions, significance testing, and error confidence bounds.
Machine Learning Fundamentals: Knowing how algorithms function mathematically under the hood to prevent overfitting.
Business Understanding: Connecting model outputs directly to revenue, cost reduction, or risk mitigation metrics.
Technical Documentation: Maintaining clean, documented GitHub repositories with production-grade Readme files.
GitHub/Project Presentation: Providing live app links (Streamlit or Hugging Face) and clear visual diagrams.
Data Science Beginner Projects to Build Your Foundation
Targeting initial entry-level roles requires building foundational syntax fluency using Python, SQL, and introductory statistical libraries. Developing these initial portfolio assets works best alongside essential data science tools and skills.
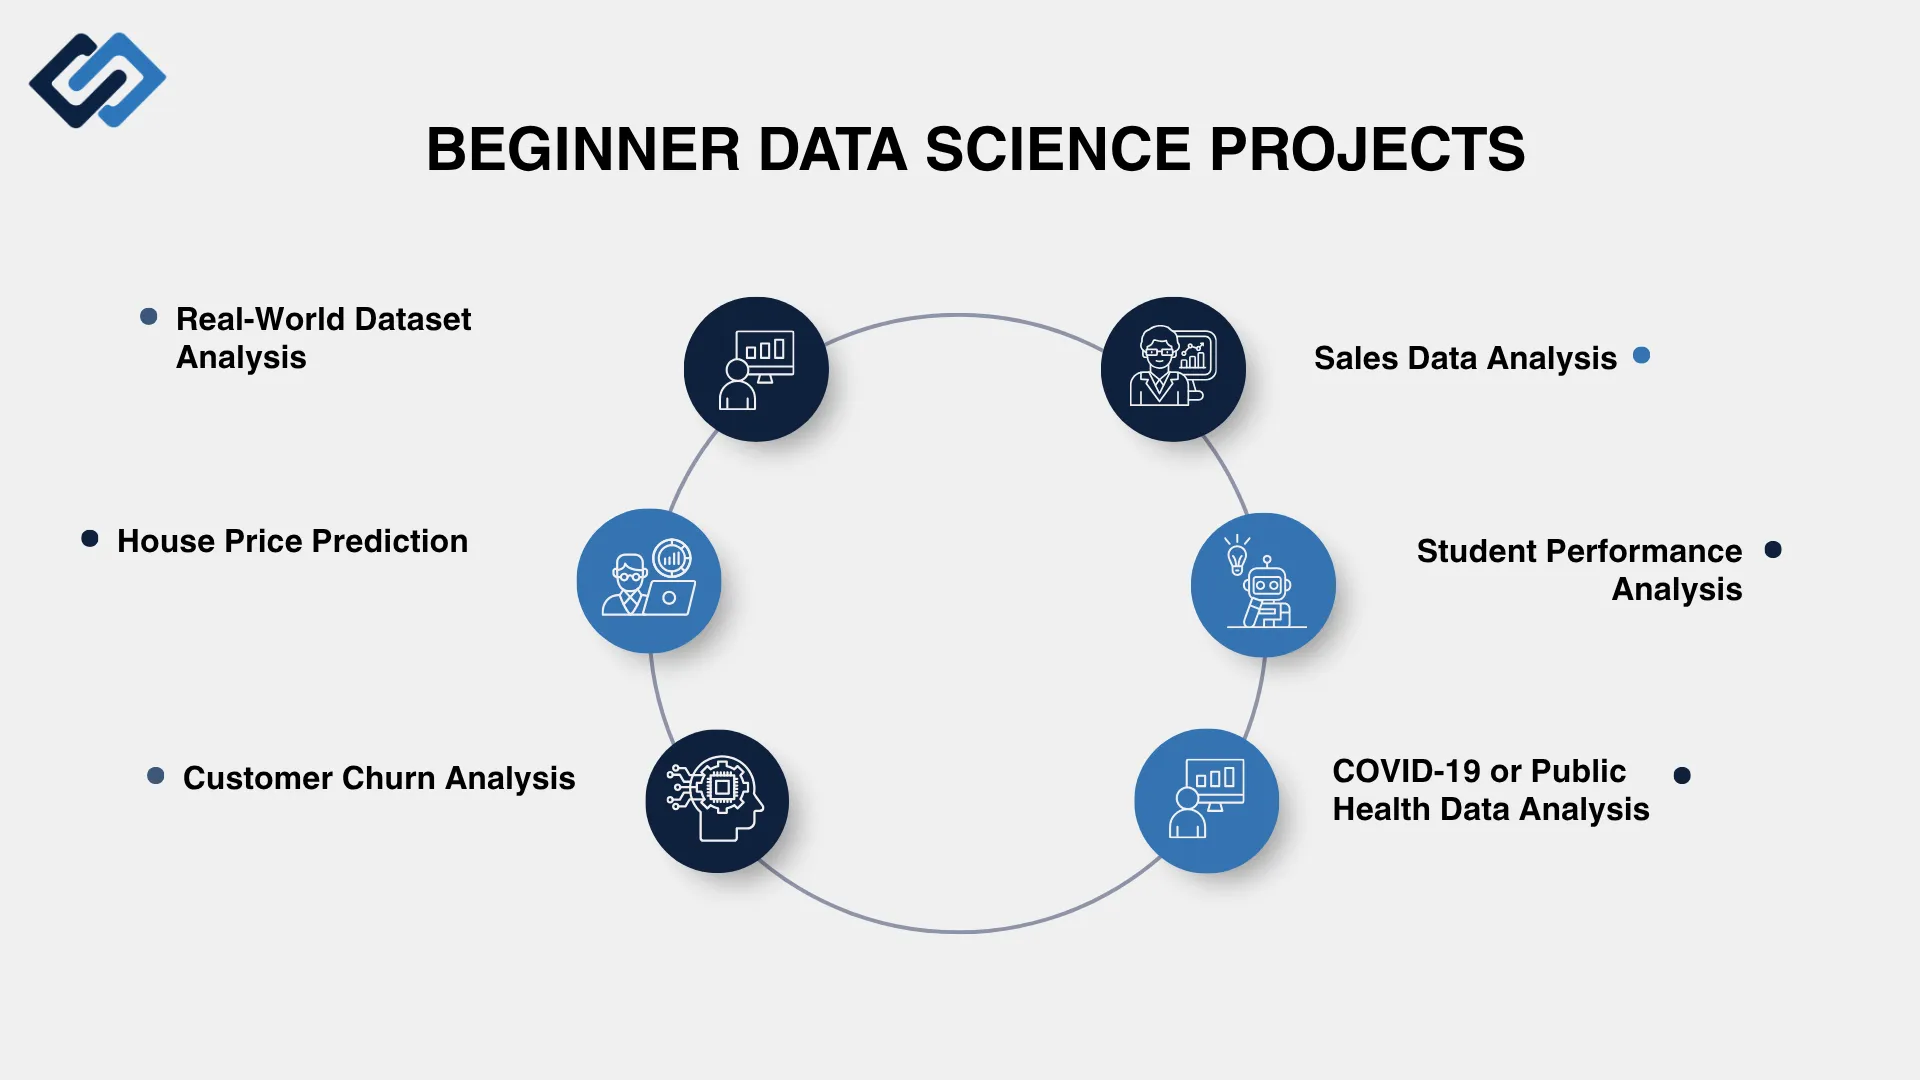
1. Exploratory Data Analysis of a Real-World Dataset
Key Skills Demonstrated: Data cleaning, missing value imputation, statistical aggregation, univariate/bivariate visualization.
Tools and Technologies Used: Python, Pandas, NumPy, Matplotlib, Seaborn, Jupyter Notebook.
Project Outcome: A detailed exploratory report uncovering hidden operational patterns across a 50,000-row public dataset.
2. House Price Prediction
Key Skills Demonstrated: Linear regression, feature scaling, handling ordinal categorical variables, evaluation metrics (MAE, RMSE).
Tools and Technologies Used: Python, Scikit-Learn, Pandas, Matplotlib.
Project Outcome: Build and evaluate a regression model that predicts residential property prices using metrics such as MAE, RMSE, and R².
3. Customer Churn Analysis
Key Skills Demonstrated: Binary classification concepts, logistic regression, correlation heatmaps, customer group comparison.
Tools and Technologies Used: Python, Pandas, Seaborn, Scikit-Learn.
Project Outcome: Identification of top churn drivers for a telecommunications provider with actionable retention strategies.
4. Sales Data Analysis
Key Skills Demonstrated: Time-based aggregation, grouping operations, calculating rolling averages, seasonal pattern detection.
Tools and Technologies Used: Python, Pandas, Plotly, Jupyter.
Project Outcome: An interactive sales analytics notebook identifying high-margin product categories and peak purchasing windows.
5. Student Performance Analysis
Key Skills Demonstrated: Hypothesis testing, demographic feature analysis, scatter plot visualizations, multi-variable correlation.
Tools and Technologies Used: Python, SciPy, Seaborn, Pandas.
Project Outcome: Statistical report detailing key socioeconomic variables impacting academic test outcomes.
6. COVID-19 or Public Health Data Analysis
Key Skills Demonstrated: Time-series aggregation, normalization per capita, geospatial visualization mapping, trend forecasting.
Tools and Technologies Used: Python, Pandas, Folium, Plotly.
Project Outcome: Interactive geographic map displaying transmission rates and vaccination coverage trends over time.
Data Analysis Projects to Develop Practical Skills
Data analysis projects focus specifically on querying, business intelligence dashboards, database joins, and converting historical operational records into immediate executive summaries.
Project Title | Primary Focus Area | Core Stack | Key Metric / Deliverable |
1. E-Commerce Sales Analysis | SQL aggregation & dynamic reporting | PostgreSQL, Python, Metabase | Executive revenue deck by region and seasonality |
2. Customer Segmentation Analysis | RFM (Recency, Frequency, Monetary) modeling | Python, SQL, Power BI | Segmented customer persona matrix |
3. Marketing Campaign Performance | Channel attribution & ROI calculation | Excel, Python, Tableau | Conversion funnel dashboard with CAC metrics |
4. Financial Data Analysis | Variance tracking & expense trends | SQL, Python, Plotly | Portfolio risk and historical volatility report |
5. Employee Attrition Analysis | HR analytics & turnover drivers | Python, Seaborn, Power BI | Flight-risk identification matrix |
6. Business Intelligence Dashboard | Dynamic reporting & metric monitoring | Power BI / Tableau, SQL | Multi-tab executive KPI dashboard |
Intermediate Data Science Projects
Intermediate projects transition your code from basic exploratory notebooks into modular, reusable machine learning pipelines.
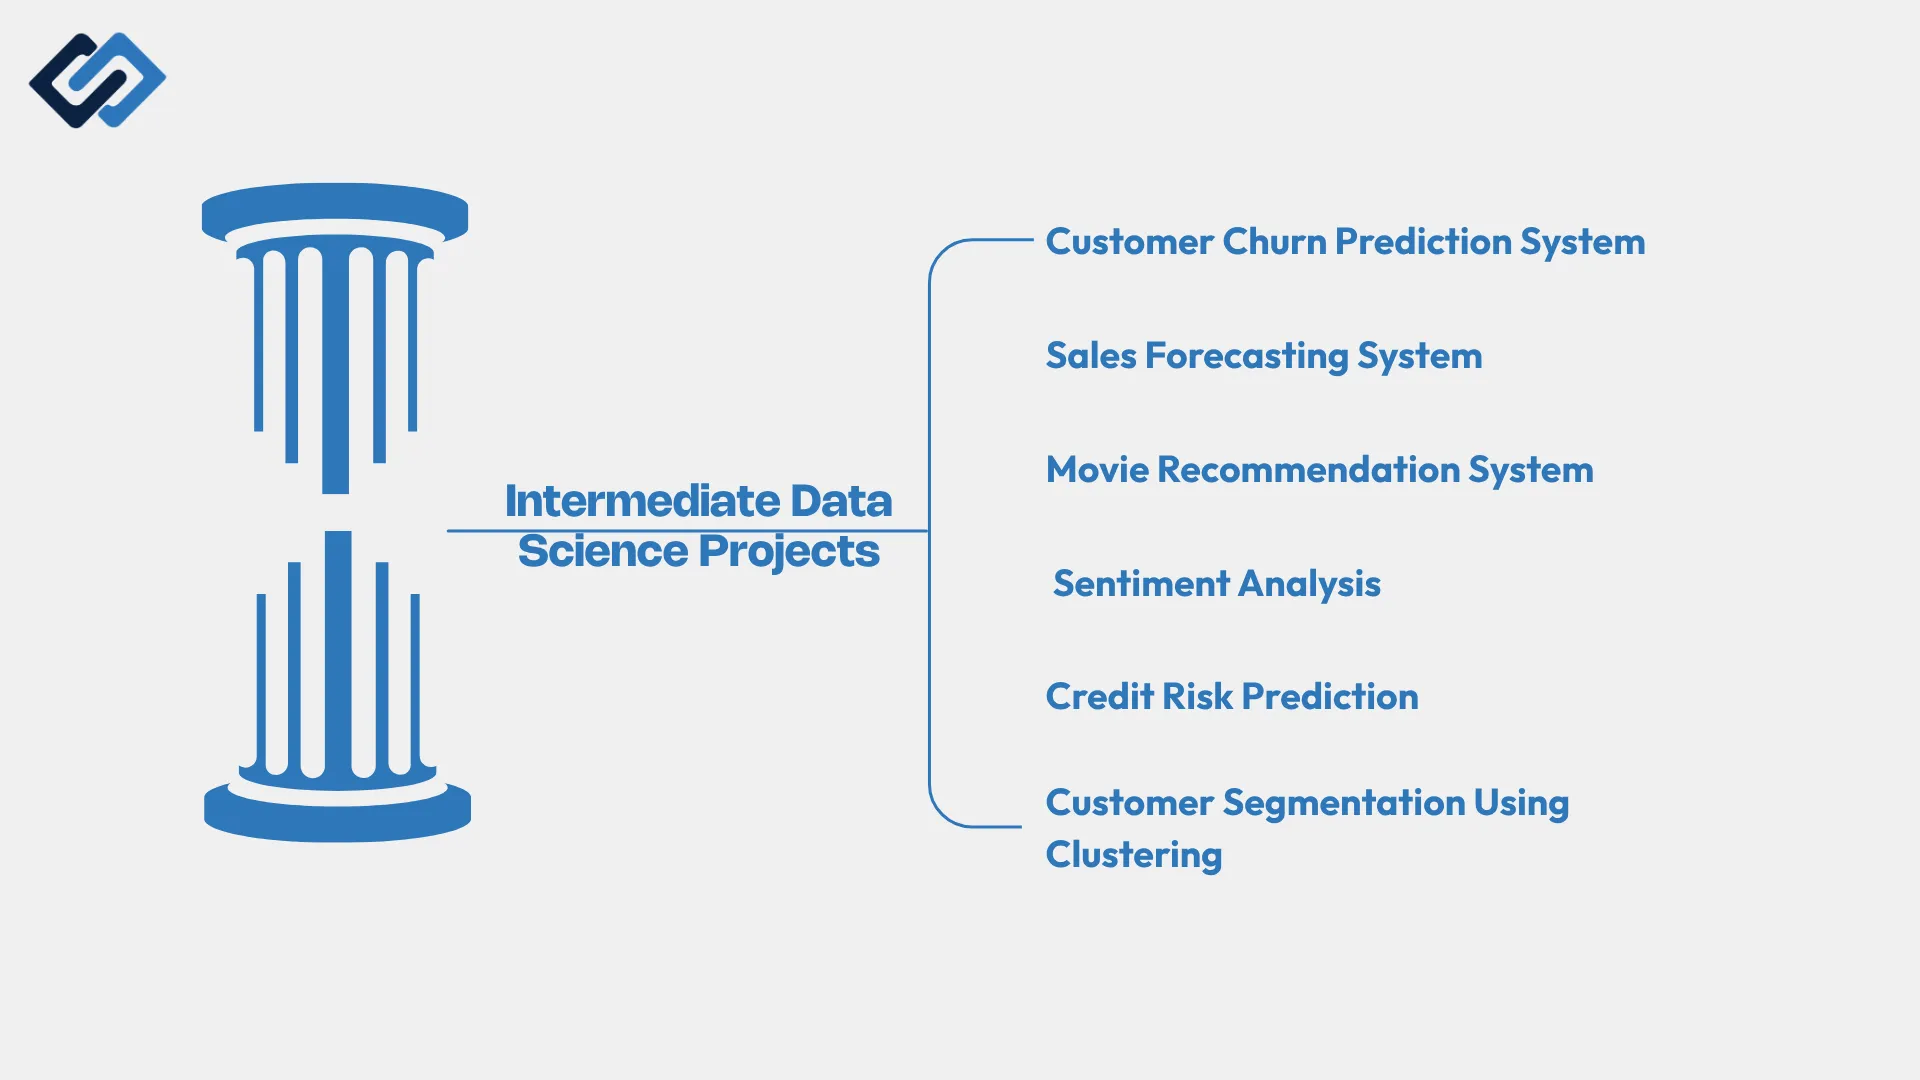
1. Customer Churn Prediction System
Key Skills Demonstrated: Pipeline construction, hyperparameter tuning via GridSearchCV, model persistence with Joblib, class imbalance handling.
Tools and Technologies Used: Python, Scikit-Learn, XGBoost, Pandas.
Project Outcome: An optimized gradient boosting classifier achieving an 0.88 ROC-AUC score on unseen test data.
2. Sales Forecasting System
Key Skills Demonstrated: Lag feature generation, seasonality modeling, evaluation via WAPE and RMSE, time-series split validation.
Tools and Technologies Used: Python, Prophet, LightGBM, Statsmodels.
Project Outcome: An automated time-series engine forecasting store-level weekly revenue 12 weeks into the future.
3. Movie Recommendation System
Key Skills Demonstrated: Sparse matrix operations, Singular Value Decomposition (SVD), hybrid collaborative filtering algorithms.
Tools and Technologies Used: Python, Surprise, SciPy, Pandas.
Project Outcome: A personalized recommendation engine producing top-10 movie suggestions based on user viewing history.
4. Sentiment Analysis
Key Skills Demonstrated: Text preprocessing (tokenization, stop-word removal, lemmatization), TF-IDF vectorization, Naive Bayes, VADER.
Tools and Technologies Used: Python, NLTK, Scikit-Learn, TextBlob.
Project Outcome: A text processing classifier rating customer product reviews as positive, negative, or neutral with 86% accuracy.
5. Credit Risk Prediction
Key Skills Demonstrated: Scorecard modeling, probability calibration, risk threshold setting, cost-benefit analysis tuning.
Tools and Technologies Used: Python, Scikit-Learn, Imbalanced-Learn, Plotly.
Project Outcome: A risk classification model reducing simulated loan default losses by 14% via probability threshold tuning.
6. Customer Segmentation Using Clustering
Key Skills Demonstrated: Dimensionality reduction (PCA), K-Means clustering, Silhouette Analysis, Elbow Method evaluation.
Tools and Technologies Used: Python, Scikit-Learn, Seaborn, Matplotlib.
Project Outcome: Unsupervised grouping of e-commerce users into four distinct behavioral personas for target marketing.
Advanced Data Science Project Ideas for Your Portfolio
Advanced projects demonstrate production-ready MLOps practices, containerized code bases, API creation, and streaming analytics capabilities.
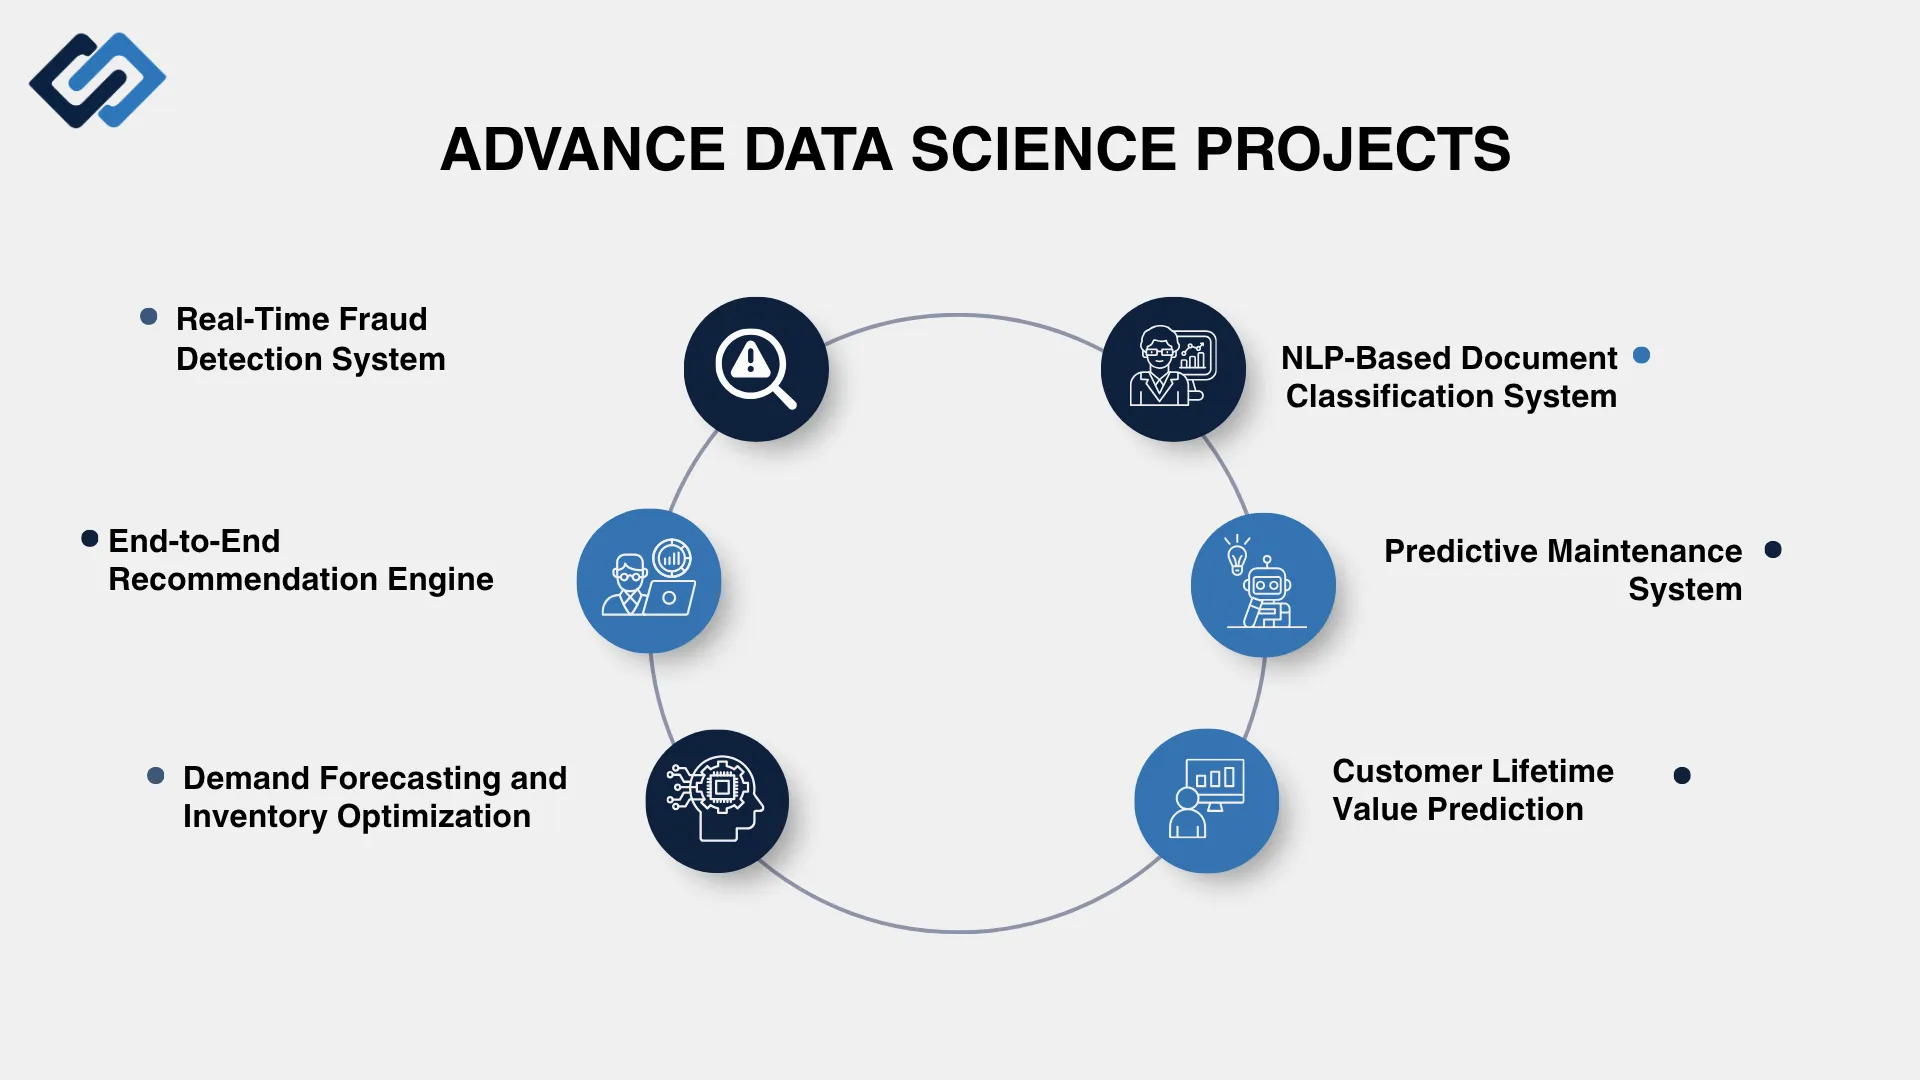
1. Real-Time Fraud Detection System
Key Skills Demonstrated: Real-time data processing, API endpoint serving, latency-optimized model scoring, anomaly detection.
Tools and Technologies Used: Python, FastAPI, Docker, LightGBM, Kafka (or Redis).
Project Outcome: A microservice evaluating incoming financial transaction payloads for fraud probabilities under 50 milliseconds.
2. End-to-End Recommendation Engine
Key Skills Demonstrated: Deep learning recommendations, vector embeddings, similarity search, full web GUI deployment.
Tools and Technologies Used: Python, PyTorch, FAISS, Streamlit, Docker.
Project Outcome: A fully deployed web interface recommending visually and textually similar products dynamically.
3. Demand Forecasting and Inventory Optimization
Key Skills Demonstrated: Multi-item hierarchical time-series, safety stock calculation, automated retraining triggers.
Tools and Technologies Used: Python, XGBoost, MLflow, Streamlit, PostgreSQL.
Project Outcome: An inventory decision platform optimizing stock reorder points to minimize carrying costs.
4. NLP-Based Document Classification System
Key Skills Demonstrated: Transformer fine-tuning, BERT architecture, document extraction pipelines, multi-class text categorization.
Tools and Technologies Used: Python, Hugging Face Transformers, PyTorch, FastAPI.
Project Outcome: An automated classification API sorting incoming corporate legal documents into six operational categories.
5. Predictive Maintenance System
Key Skills Demonstrated: Industrial IoT sensor data handling, remaining useful life (RUL) estimation, survival analysis.
Tools and Technologies Used: Python, Scikit-Learn, XGBoost, Dash/Plotly.
Project Outcome: Equipment degradation monitor predicting machinery failure windows to prevent unplanned operational downtime.
6. Customer Lifetime Value Prediction
Key Skills Demonstrated: Probabilistic customer valuation models (BG/NBD and Gamma-Gamma), regression modeling, RFM integration.
Tools and Technologies Used: Python, Lifetimes, Scikit-Learn, Streamlit.
Project Outcome: Analytical dashboard calculating long-term net present value per customer acquisition channel.
Data Science Capstone Projects for a Job-Ready Portfolio
A capstone project represents your flagship asset. It combines data engineering, complex analytics, machine learning, MLOps, and visual storytelling into a unified platform. You can review our strategic 2026 learning roadmap to see how capstones fit into your broader learning journey.
1. End-to-End E-Commerce Analytics and Prediction Platform
Problem Statement: Online retailers lack integrated tooling to unify past purchase analytics with real-time churn prediction and personalized item recommendations.
Key Skills Demonstrated: Data pipeline engineering, supervised classification, unsupervised clustering, web deployment, API design.
Tools and Technologies Used: Python, PostgreSQL, Scikit-Learn, FastAPI, Streamlit, Docker.
Project Workflow: Raw database extraction –>SQL transformation –> Automated feature generation –> Churn model training –> REST API creation –>Interactive UI rendering.
Evaluation Metrics: ROC-AUC, precision, recall, precision-recall curves, and API response time.
Project Outcome: A hosted web application allowing store managers to upload sales files, view customer risk scores, and run automated promotion triggers.
Why It Is Portfolio-Worthy: Proves full-stack capability from database extraction to cloud deployment.
2. Healthcare Risk Prediction System
Problem Statement: Hospitals require early alert systems to detect high-risk patient readmissions before discharge.
Key Skills Demonstrated: Handling clinical datasets, missing data imputation, model explainability (SHAP), compliance-minded model validation.
Tools and Technologies Used: Python, XGBoost, SHAP, Streamlit, PyTorch.
Project Workflow: Clinical record cleaning –> Imbalanced dataset sampling –> XGBoost modeling –> SHAP explainability scoring –> Dashboard interface.
Evaluation Metrics: Recall (0.84 to minimize missed risk cases), F1-Score, SHAP impact plots.
Project Outcome: A doctor-facing dashboard displaying readmission risks accompanied by localized explanations for every clinical factor.
Why It Is Portfolio-Worthy: Highlights model interpretability, essential for highly regulated domain positions.
3. Real Estate Price Prediction and Market Analysis
Problem Statement: Property investors struggle to aggregate historical neighborhood trends with future home price predictions.
Key Skills Demonstrated: Web scraping, spatial mapping, time-series forecasting, advanced ensemble regression.
Tools and Technologies Used: Python, Beautiful Soup, Geopandas, LightGBM, Plotly Dash.
Project Workflow: Scraping listings –> Geocoding addresses –> Spatial join aggregation –> Regression modeling –> Dynamic map UI construction.
Evaluation Metrics: MAE, MAPE (<6% error rate), $R^2$ Score (0.91).
Project Outcome: An interactive map portal showing pricing heatmaps alongside predictive 12-month valuation estimates.
Why It Is Portfolio-Worthy: Demonstrates raw data acquisition capabilities combined with spatial analytics.
4. Financial Fraud Detection Platform
Problem Statement: Payment processors need continuous monitoring systems to flag suspicious transaction streams without interrupting real-time checkout flows.
Key Skills Demonstrated: Streaming analytics, imbalanced class handling, MLOps tracking, containerization.
Tools and Technologies Used: Python, Docker, MLflow, FastAPI, Scikit-Learn.
Project Workflow: Synthetic transaction stream generation –> Feature scaling –> Anomaly detection scoring –> Metric logging via MLflow –> Docker deployment.
Evaluation Metrics: Precision at high Recall thresholds, ROC-AUC, API response times.
Project Outcome: A containerized microservice that logs model versions, tracks metric drift, and serves instant risk scores via REST endpoints.
Why It Is Portfolio-Worthy: Demonstrates modern MLOps, model tracking, and production API serving skills.
5. Personalized Recommendation Platform
Problem Statement: Content platforms require real-time personalization layers to boost user engagement and watch times.
Key Skills Demonstrated: Matrix factorization, vector databases, API construction, interactive UI design.
Tools and Technologies Used: Python, FAISS, PyTorch, FastAPI, Streamlit.
Project Workflow: User interaction logging –> Embedding generation –> FAISS vector indexing –> Fast nearest-neighbor query retrieval –> Streamlit rendering.
Evaluation Metrics: Mean Reciprocal Rank (MRR), Coverage, Hit Rate at K.
Project Outcome: A functional streaming service replica serving instant personalized media feeds tailored to user history.
Why It Is Portfolio-Worthy: Leverages modern vector search technologies heavily utilized in modern AI workflows.
Data Science Examples Across Different Industries
Examining operational applications across key domain sectors helps tailor your portfolio to specific company niches.
Data Science in Finance
Fraud Detection: Anomaly detection models evaluating card transaction patterns in real time.
Credit Scoring: Logistic regression scorecards and decision trees evaluating loan applicant risk.
Risk Prediction: Value at Risk (VaR) calculations and stress-testing capital reserves.
Dynamic pricing: real-time pricing algorithms adjusting item rates based on market momentum.
Data Science in Healthcare
Disease Prediction: Supervised classification alerting doctors to early onset diabetic or cardiovascular risks.
Patient Risk Analysis: Identifying likelihood of emergency room readmission post-surgery.
Medical Image Analysis: Convolutional Neural Networks (CNNs) segmenting anomalies in X-rays and MRI scans.
Hospital Resource Forecasting: Predicting bed availability and emergency room staffing needs using time-series models.
Data Science in Retail and E-Commerce
Recommendation Systems: Collaborative filtering engines driving product recommendations.
Demand Forecasting: Predicting inventory turnover across distribution centers to optimize supply chains.
Customer Segmentation: Clustering buyers into target groups for personalized dynamic pricing.
Dynamic Pricing: Real-time pricing algorithms adjusting item rates based on regional demand and stock levels.
Data Science in Marketing
Customer Segmentation: Behavioral grouping based on RFM scores and purchase frequency.
Churn Prediction: Early warning classification identifying disengaged subscribers before cancellation.
Campaign Optimization: A/B testing frameworks measuring conversion lift across ad channels.
Customer Lifetime Value: Probabilistic modeling predicting total net margin generated per buyer cohort.
Data Science in Real Estate
House Price Prediction: Automated Valuation Models (AVMs) pricing residential assets.
Property Valuation: Regression tools mapping neighborhood feature values against historical sale prices.
Market Trend Analysis: Spatial visualization tracking rental yield fluctuations across target zip codes.
Demand Forecasting: Time-series models predicting future commercial construction permit applications.
How to Find a Dataset for a Data Science Project
Finding the right dataset prevents your project from looking like a cloned tutorial.
What Makes a Good Data Science Dataset?
Relevant Variables: Contains a healthy balance of numerical, categorical, and temporal fields.
Sufficient Observations: Has enough records (without quick overfitting) to train machine learning models effectively without quick overfitting.
Data Quality: Includes realistic flaws like missing records, noisy entries, or messy formatting requiring genuine cleaning.
Real-World Relevance: Reflects actual business operations or societal challenges rather than artificial synthetic outputs.
Appropriate Complexity: Provides sufficient multi-variable depth to perform feature engineering.
Clear Target Variable: Contains distinct outcome targets for supervised tasks, or clear logical groupings for unsupervised tasks.
Where to Find Datasets
Kaggle Datasets: Excellent source for niche domain files, though avoid using overused competition datasets like Titanic or Iris for primary portfolio pieces. Explore Kaggle Datasets.
UCI Machine Learning Repository: Reliable, clean academic ucidatasets spanning diverse technical fields.
Government Open-Data Portals: Data.gov, UK Data Service, and European Data Portal for large public records.
World Bank Open Data: Global economic, financial, and population metrics ideal for macro-level analysis.
Google Dataset Search: Powerful specialized search engine for finding datasets hosted across public research pages.
Web Scraping & APIs: Extracting custom datasets from public web portals using Beautiful Soup or official REST APIs (Reddit, Twitter/X, Spotify).
How to Choose the Right Dataset for Your Skill Level
Skill Level | Dataset Characteristics | Recommended Format |
Beginner | Single table, clean CSV | Structured tabular files |
Intermediate | Multi-table relational SQL | Databases, APIs, JSON |
Advanced | Large, uncleaned, streaming | Cloud storage, web scraping |
How to Turn a Data Science Project Into a Resume-Worthy Project
Building the code is only half the battle. Documenting and presenting your findings determines whether your resume lands interview callbacks. Exploring options for landing entry-level data roles can provide context on employer expectations, while checking our data scientist compensation metrics can help align your career targets.
What to Include in Your Data Science Project
Problem Statement: Define the core business issue or research objective directly at the top of your Readme.
Dataset Description: Detail data origins, field definitions, row counts, and licensing context.
Data Preprocessing: Explain missing value logic, scaling methods, and encoding choices.
Exploratory Analysis: Include 2 to 3 key visualizations highlighting foundational trends.
Methodology: Detail candidate algorithms considered and cross-validation strategies used.
Model Selection: Explain why the final model was chosen over baseline alternatives.
Evaluation: Show primary metrics (Precision, Recall, F1, RMSE) on hold-out test sets.
Business Impact: Quantify calculated cost savings, efficiency gains, or risk reductions.
Limitations: Candidly outline dataset edge cases, potential model bias, or data constraints.
Future Improvements: Outline next steps like adding live API integrations or deeper neural networks.
How to Write Data Science Projects on Your Resume
Use the standard formula: Action Verb + Technical Method + Dataset/Problem + Measurable Result.
Weak Resume Bullet Point | Strong Resume Bullet Point |
Created a house price prediction model using Python. | Built a gradient boosted regression pipeline using XGBoost and Scikit-Learn to forecast real estate valuations across 50k listings, achieving a 0.89 $R^2$ score and reducing pricing estimation error by 14%. |
Did customer churn analysis in Jupyter Notebook. | Engineered a customer retention classifier on 10k telecommunications records using Logistic Regression and SMOTE, identifying key churn indicators and boosting churn detection recall to 84%. |
Built a dashboard in Power BI for sales data. | Designed a multi-tab Power BI dashboard querying a PostgreSQL backend, consolidating regional sales trends across 12 product lines to streamline monthly executive reporting workflows. |
GitHub Checklist for Data Science Projects
Clean README.md: Professional layout using Markdown formatting, visual charts, and architecture diagrams.
Clear Folder Structure: Separate directories for data/, notebooks/, src/, and reports/.
Requirements File: Include a requirements.txt or environment.yml for complete library reproducibility.
Modular Python Scripts: Refactor messy notebook code into clean, callable .py scripts inside a source folder.
No Raw API Keys: Ensure zero credentials, sensitive passwords, or confidential tokens are committed to public history.
Interactive Demo Link: Link directly to a hosted web interface (Streamlit Community Cloud or Render).
License File: Include an open-source license (MIT or Apache 2.0) where applicable.
How Many Data Science Projects Should You Have on Your Resume?
Focus on quality over quantity. Feature 2 to 3 fully documented, original projects that highlight different technical capabilities (e.g., one end-to-end Machine Learning model, one advanced SQL/BI Dashboard, and one production API Capstone). Avoid cluttering your resume with dozens of short, generic tutorial notebooks.
How to Practice Data Science Effectively
Consistently practicing fundamental concepts builds the technical muscle memory required to solve unscripted enterprise problems. Structured preparation alongside a strategic 2026 learning roadmap keeps your skill building on schedule.
Practice Statistics for Data Science
Statistical fluency validates whether your predictive models represent real population signals or random noise.
Descriptive Statistics: Master measures of central tendency (mean, median, mode) and dispersion (variance, standard deviation, IQR).
Probability & Distributions: Understand Gaussian normal distributions, binomial distributions, Poisson processes, and the Central Limit Theorem.
Hypothesis Testing: Practice running t-tests, Chi-Square tests, and ANOVA evaluations to validate experimental splits.
Correlation & Regression: Evaluate Pearson/Spearman coefficients, Ordinary Least Squares (OLS) assumptions, and residual homoscedasticity.
Confidence Intervals & A/B Testing: Calculate margin of error bounds and construct statistical significance tests for digital product experiments.
Practice SQL With Real-World Data
SELECT & Filtering: Practice complex WHERE logic, pattern matching (LIKE), and multi-condition filtering.
JOINs: Master INNER, LEFT, RIGHT, and FULL OUTER joins across multi-table databases without introducing Cartesian product bugs.
GROUP BY & Aggregations: Aggregate records using SUM, AVG, COUNT, HAVING clauses, and conditional CASE WHEN logic.
Window Functions: Master partition calculations using ROW_NUMBER(), RANK(), DENSE_RANK(), LEAD(), and LAG().
CTEs & Subqueries: Simplify complex multi-stage analytical queries using Common Table Expressions (WITH statements).
Practice Machine Learning
Regression: Train and tune Ridge, Lasso, and Linear models to understand feature regularization.
Classification: Master Logistic Regression, Decision Trees, Random Forests, and XGBoost classifiers.
Clustering: Implement K-Means and DBSCAN algorithms on unstructured tabular records.
Feature Engineering: Practice one-hot encoding, target encoding, standard scaling, and polynomial feature creation.
Cross-Validation: Implement Stratified K-Fold cross-validation to assess true model generalization.
Hyperparameter Tuning: Compare processing efficiency between GridSearchCV and RandomizedSearchCV.
Move From Practice Problems to Complete Projects
Follow a gradual progression to turn individual practice tasks into job-ready data science projects:
Practice Problems: Solve individual Python, SQL, statistics, and machine learning problems on platforms such as LeetCode and Kaggle.
Mini Projects: Choose a single dataset and practice data cleaning, EDA, visualization, and basic model building.
End-to-End Projects: Work on a real-world problem by collecting data, building data pipelines, training models, evaluating results, and creating visualizations.
Capstone Projects: Build a complete application that includes model deployment, APIs, dashboards, version control, and production-ready workflows.
Common Mistakes to Avoid When Building Data Science Projects
Copying Kaggle Notebooks Without Understanding Them: Forking top competition notebooks without rewriting the code or understanding the underlying math will be exposed instantly during technical interviews. Reviewing common technical interview preparation tips can help you practice defending your codebase.
Choosing Projects That Are Too Simple: Relying on overused beginner datasets (Iris, Titanic, Boston Housing) communicates a lack of initiative to recruiters.
Focusing Only on Model Accuracy: Over-emphasizing minor accuracy increases while ignoring business context, model interpretability, or data leakage issues.
Ignoring Data Cleaning and EDA: Jumping straight into model.fit() without performing thorough exploratory data checks leads to poor feature choices and fragile models.
Building Projects Without a Clear Problem Statement: Training algorithms without defining what business metric or operational task the model is improving.
Not Explaining Business Impact: Failing to convert technical metrics (like RMSE or Log-Loss) into executive terms like dollar savings, hours reduced, or retention lifts.
Leaving Projects Undocumented on GitHub: Uploading unorganized .ipynb files containing unexecuted cell outputs, missing Readme files, and messy comments.
Listing Too Many Similar Projects on Your Resume: Including four almost identical binary classification projects rather than showing breadth across SQL, ML, time-series, and deployment.
Frequently Asked Questions
Do any data science courses offer industry projects or internships?
Yes. Many data science courses include industry projects, capstones, and internship opportunities to help learners gain practical experience.
How long does a data science project take?
It depends on the complexity. Beginner projects may take 1–2 weeks, while advanced capstone projects can take 6–8 weeks.
How to build a data science project from scratch?
Start with a clear problem, collect and clean data, perform EDA, build and evaluate models, then document and deploy the project.
How to describe data science projects on a resume?
Highlight the problem, tools, techniques, and measurable results in concise, impact-focused bullet points.
How to find data science projects?
Find ideas from real-world problems and public datasets on platforms such as Kaggle, UCI, and government open-data portals.
How to organize a data science project?
Use a clear folder structure for data, notebooks, source code, and reports, and include a README and requirements file for easy reproduction.