
August 31, 2026 · Dhiraj Bashyal
Data Science With Python: A Complete Guide for Beginners
On this page
Data science drives automated decision-making and predictive analytics across every major enterprise technology stack. Choosing to learn data science with python offers the most practical path to build job-ready technical skills from scratch.
At Commit Career, we help international students build real-world experience through live, mentor-led online tech courses. If you are preparing to study in North America, explore our dedicated data science course in the USA. For learners aiming for top technology roles across Europe or Oceania, check out our industry-aligned data science course in the UK.
This guide walks you through every stage of data science and python development, from core language constructs to advanced machine learning models and portfolio projects.
What Is Data Science With Python?
What Is Data Science?
Data science combines statistical analysis, programming, and domain knowledge to extract actionable business insights from structured and unstructured data. It covers the complete data lifecycle: collection, cleaning, exploratory analysis, predictive modeling, and business deployment.
Why Is Python Used in Data Science?
Python is the dominant language in data science due to its clear syntax, massive open-source ecosystem, and strong community support. It allows beginners to focus on analytical logic rather than low-level memory handling.
Python in Data Science vs. Traditional Data Analysis
Traditional data analysis relies heavily on static spreadsheets and BI dashboards. While useful for simple reporting, spreadsheets struggle with complex algorithms and large datasets. Data science using python enables scalable calculations, automated data pipelines, and advanced machine learning models.
What Can You Do With Data Science Using Python?
Predict customer churn and revenue growth.
Build recommendation engines for e-commerce platforms.
Automate financial risk modeling and fraud detection.
Perform sentiment analysis on social media text feeds.
Why Learn Data Science With Python?
Python Is Beginner-Friendly: Python syntax reads closely to written English, making it accessible for non-technical beginners and career changers.
Python Has a Large Data Science Ecosystem: The Python ecosystem provides thousands of pre-built packages, turning complex mathematical operations into single-line function calls.
Python Supports Machine Learning and AI: From Scikit-Learn to PyTorch, Python hosts the core frameworks powering modern artificial intelligence and predictive modeling.
Python Skills Are Used Across Industries: Finance, healthcare, retail, logistics, and tech companies rely on Python for data analysis and software development.
Python and SQL: Why You Should Learn Both: While Python handles data transformation, visualization, and machine learning, SQL extracts data from relational databases. Completing data science fundamentals with python and sql ensures you can handle end-to-end data tasks in any corporate environment.
Python Basics You Need for Data Science
Variables and Data Types
Variables store data values in memory. Essential primitive types include integers (int), floating-point numbers (float), text strings (str), and booleans (bool).
Lists, Tuples, Dictionaries, and Sets
Python offers four primary built-in data structures:
Lists: Ordered, mutable collections [1, 2, 3].
Tuples: Ordered, immutable collections (1, 2, 3).
Dictionaries: Key-value mappings {"role": "analyst"}.
Sets: Unordered collections of unique values {1, 2, 3}.
Conditional Statements
Use if, elif, and else blocks to direct program logic based on underlying data conditions.
Loops
for and while loops automate repetitive execution across datasets and iterable objects.
Functions
Reusable code blocks defined with the def keyword maintain clean, modular, and readable scripts.
Working With Files
Reading and writing local CSV, JSON, and text files using Python's built-in file handlers.
Object-Oriented Programming Basics
Understanding classes, objects, and methods helps you work with complex python data science frameworks.
Python Data Science Basics: What Beginners Should Know
Focus on understanding vectorization over nested loops, writing modular python data science scripts, and mastering memory management fundamentals. Prioritizing these python data science essentials accelerates your progress into advanced data libraries.
Python Data Science Libraries and Packages
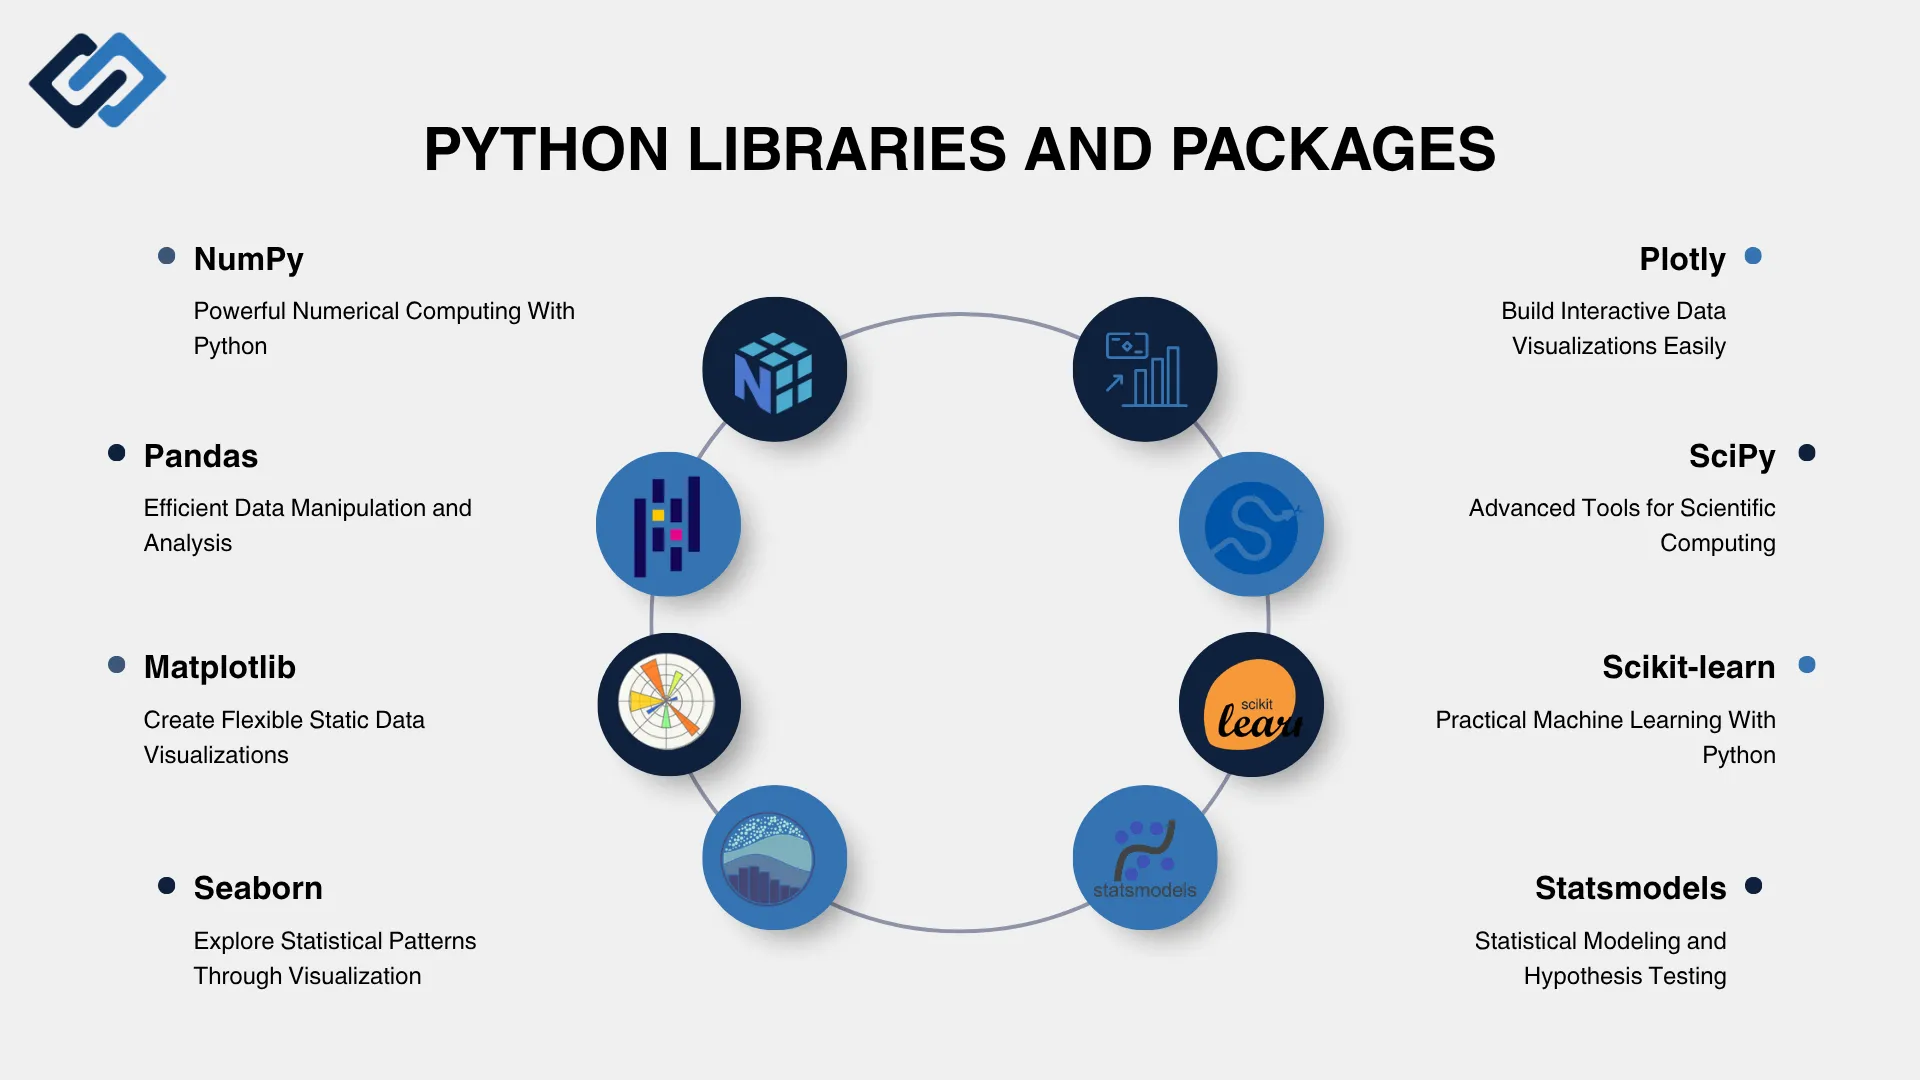
Python's data science ecosystem contains specialized libraries for numerical computing, data manipulation, visualization, statistics, and machine learning. You don't need to learn all of them at once. Start with the libraries that match the stage of the workflow you're currently learning.
NumPy for Numerical Computing
NumPy provides multidimensional arrays and efficient numerical operations. It is useful for mathematical calculations and forms part of the foundation for many scientific Python libraries.
import numpy as np
numbers = np.array([10, 20, 30, 40])
print(numbers.mean())
Pandas for Data Manipulation
Pandas provides DataFrame and Series structures for working with structured data. It supports common operations such as filtering, grouping, merging, sorting, and handling missing values.
import pandas as pd
df = pd.read_csv("sales.csv")
print(df.head())
print(df.describe())
Matplotlib for Data Visualization
Matplotlib is a flexible visualization library that can create line charts, bar charts, scatter plots, histograms, and many other types of static graphics.
Seaborn for Statistical Visualization
Seaborn provides a higher-level interface for creating statistical visualizations. It is useful for exploring distributions, relationships between variables, and correlation patterns.
Plotly for Interactive Visualization
Plotly allows you to create interactive charts that support features such as hovering, zooming, and filtering. It can be useful when readers or stakeholders need to explore the underlying data.
SciPy for Scientific Computing
SciPy extends NumPy with functionality for scientific and numerical computing, including optimization, integration, signal processing, and additional statistical methods.
Scikit-learn for Machine Learning
Scikit-learn provides a consistent interface for many traditional machine learning tasks, including classification, regression, clustering, preprocessing, model selection, and evaluation.
Statsmodels for Statistical Analysis
Statsmodels provides tools for statistical modeling, hypothesis testing, regression analysis, and time-series analysis. It is particularly useful when statistical inference and model interpretation are important.
Python Data Science Tools and Development Environment
Jupyter Notebook: An interactive browser environment combining live code execution, markdown documentation, and inline visualizations.
Google Colab: A cloud-hosted Jupyter notebook platform offering free GPU access and effortless team collaboration.
Visual Studio Code: A lightweight code editor equipped with rich Python extensions, debugging tools, and Git integration for production development.
Python Data Science IDEs: Dedicated python data science ide options like PyCharm and Spyder offer structured project navigation, variable inspection, and environment management.
Package Managers and Virtual Environments: Tools like pip, conda, and venv isolate project dependencies and maintain clean python data science tools setups.
Data Science With Python: Step-by-Step Workflow
Define the Data Science Problem: Identify business objectives, specify target metrics, and frame analytical hypotheses clearly.
Collect and Load Data: Gather raw data from relational databases, public REST APIs, or local files.
Explore the Dataset: Inspect data dimensions, column types, missing values, and initial statistical distributions.
Clean and Preprocess Data: Resolve missing values, remove duplicate records, correct structural errors, and scale numeric features.
Perform Exploratory Data Analysis: Analyze statistical relationships, correlations, and distributions across features.
Visualize the Data: Create clear plots to summarize analytical patterns and convey findings.
Build a Machine Learning Model: Select, train, and hyperparameter-tune algorithms suited to your problem.
Evaluate the Model: Measure performance using evaluation metrics like accuracy, precision, recall, or root mean squared error.
Interpret and Communicate Results: Translate model predictions into actionable recommendations for business stakeholders.
How to Load and Explore Data Using Python
Reading CSV Files With Pandas: Load structured tabular datasets into memory using pd.read_csv('filename.csv').
Importing Excel and Other Data Formats: Pandas supports multiple input formats, including Excel (pd.read_excel), JSON (pd.read_json), and SQL databases (pd.read_sql).
Understanding Rows, Columns, and Data Types: Use df.head(), df.info(), and df.describe() to inspect shape, column names, and data types.
Inspecting Missing and Duplicate Data: Locate missing records using df.isnull().sum() and locate duplicate rows with df.duplicated().sum().
Data Preprocessing With Python
Handling Missing Values: Impute missing values using mean, median, or mode with df.fillna(), or drop incomplete rows using df.dropna().
Removing Duplicate Data: Eliminate identical records from your dataset using df.drop_duplicates().
Detecting and Handling Outliers: Identify extreme values using box plots or Z-score thresholds, then cap or remove them based on domain context.
Encoding Categorical Data: Convert string labels into numeric formats using One-Hot Encoding (pd.get_dummies()) or Label Encoding.
Feature Scaling: Standardize numerical ranges using StandardScaler or MinMaxScaler from Scikit-Learn to ensure fair algorithmic feature weighting.
Splitting Data Into Training and Testing Sets: Use Scikit-Learn's train_test_split to divide data into training (e.g., 80%) and evaluation (e.g., 20%) subsets.
Data Analysis With Python
Descriptive Statistics: Calculate measures of central tendency and dispersion, including mean, median, standard deviation, and variance.
Filtering and Sorting Data With Pandas: Extract specific row subsets using logical conditions (df[df['sales'] > 1000]) and sort results with df.sort_values().
Grouping and Aggregating Data: Compute summary metrics across distinct categories using df.groupby('category').mean().
Correlation Analysis: Quantify linear relationships between numerical variables using df.corr().
Exploratory Data Analysis (EDA): Combine statistical aggregation with visuals to test analytical hypotheses.
Data Visualization With Python
Data Visualization Using Matplotlib: Build custom line plots, scatter plots, and bar charts with complete control over axes and labels.
Data Visualization Using Seaborn: Render distribution plots, pair plots, and correlation heatmaps with refined visual styling.
Interactive Data Visualization Using Plotly: Build dynamic dashboards featuring tooltip popups and interactive zooming.
Choosing the Right Chart for Your Data
Line Charts: Trends over continuous time periods.
Bar Charts: Categorical metric comparisons.
Histograms: Single variable frequency distributions.
Scatter Plots: Bivariate numeric correlation.
Machine Learning With Python
What Is Machine Learning?
Machine learning enables systems to learn statistical patterns from historical data to make accurate future predictions without explicit rules.
Supervised vs. Unsupervised Learning
Supervised learning trains models on labeled target outputs (e.g., house price prediction). Unsupervised learning identifies hidden groupings in unlabeled data (e.g., customer segmentation).
Training and Testing Machine Learning Models
Fit model parameters on training data, then validate performance on unseen test data to prevent overfitting.
Model Evaluation and Validation
Assess model quality using metrics like Precision, Recall, F1-Score, and Mean Absolute Error.
Popular Machine Learning Algorithms in Python
The popular machine learning algorithms are:
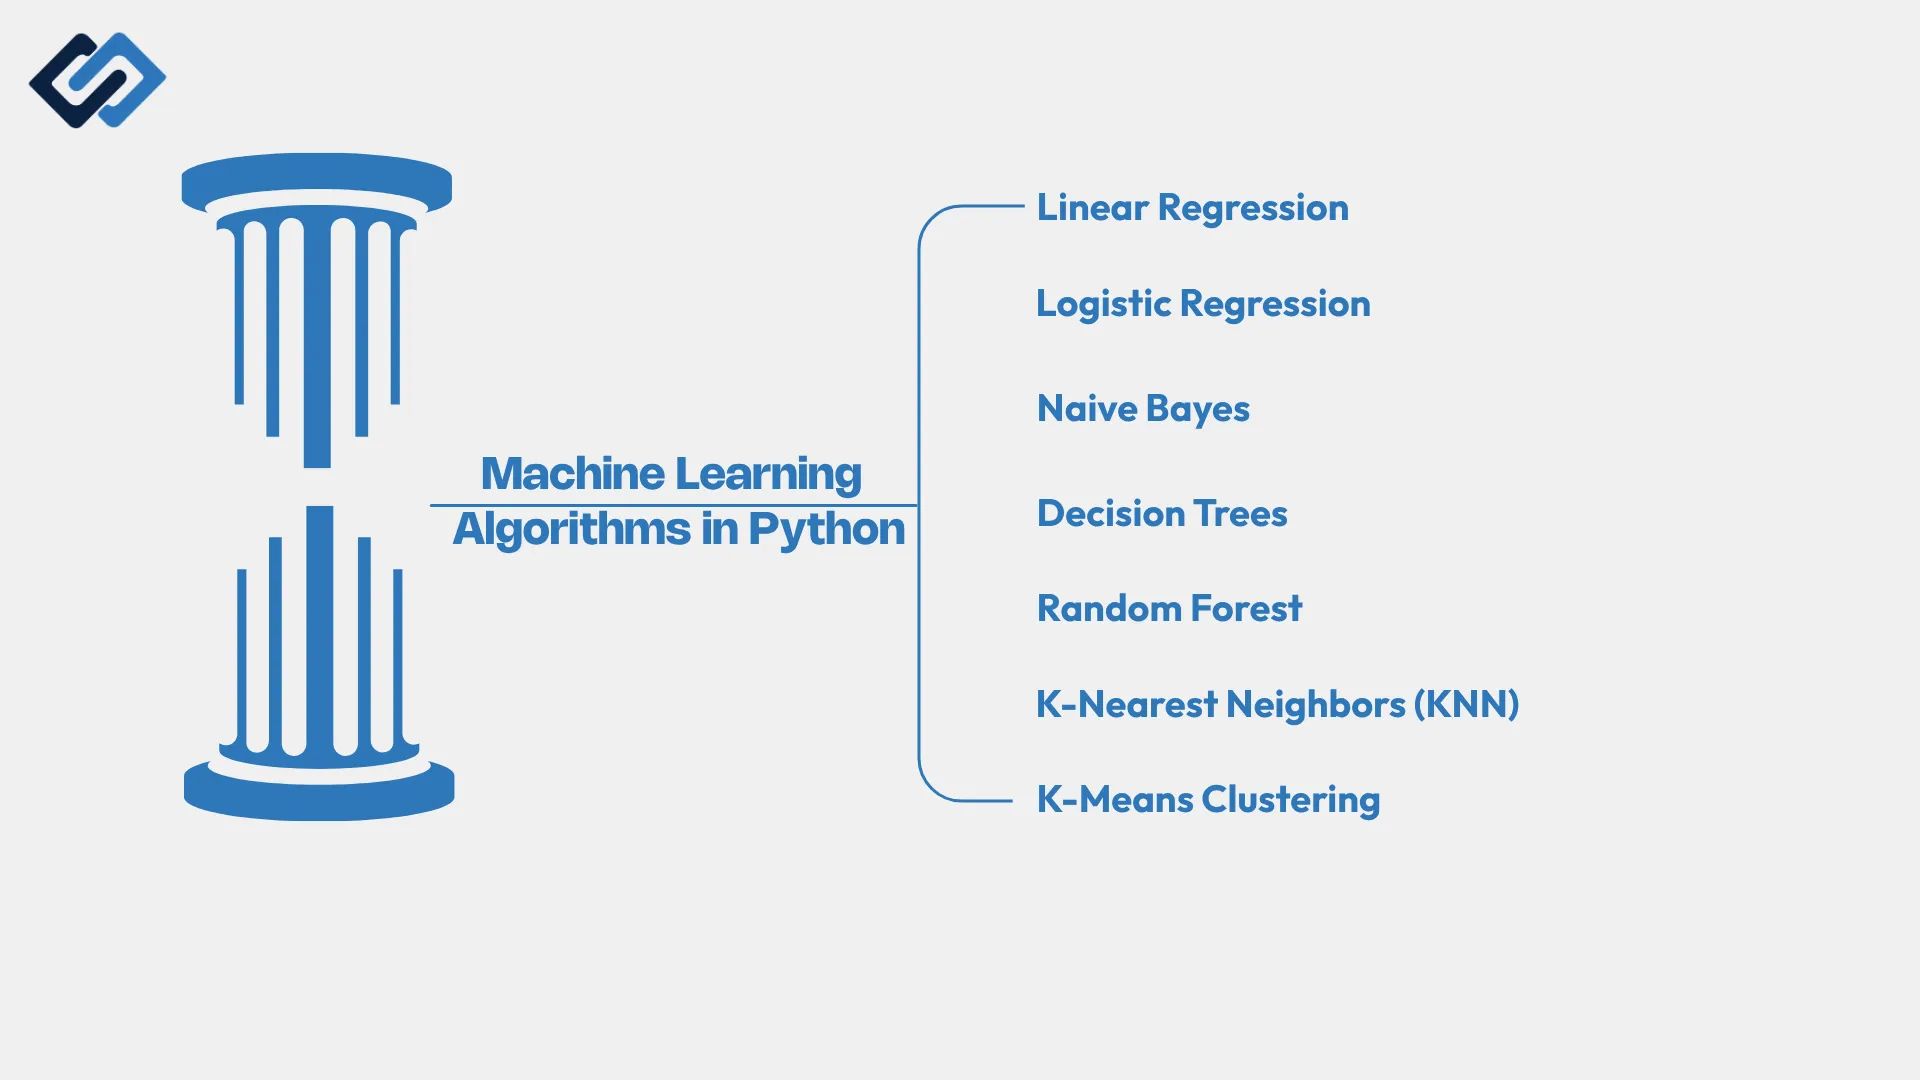
Linear Regression: Models continuous numerical targets based on linear feature relationships.
Logistic Regression: Classifies binary outcomes (e.g., pass/fail, spam/not spam).
Naive Bayes: A fast probabilistic classifier based on Bayes' theorem, commonly used for text classification.
Decision Trees: Splits datasets into branch structures based on clear feature decision thresholds.
Random Forest: An ensemble method combining multiple decision trees to improve stability and predictive accuracy.
K-Nearest Neighbors (KNN): Classifies data points based on feature similarity to neighboring points.
K-Means Clustering: Groups unlabeled records into distinct clusters based on mathematical distance.
Build a Data Science Project With Python
Choosing a Real-World Dataset: Select realistic datasets from open platforms like Kaggle, UCI Machine Learning Repository, or government open-data portals.
Defining the Business Problem: Establish a measurable goal, such as reducing customer churn or forecasting retail demand.
Cleaning and Exploring the Data: Address missing values, fix data types, and map feature distributions.
Building the Analysis: Construct meaningful features and analyze primary correlation drivers.
Creating Visualizations: Develop charts highlighting key operational drivers for decision-makers.
Building a Predictive Model: Train baseline algorithms and evaluate test set performance.
Evaluating the Results: Select the optimal model based on error metrics and business impact.
Presenting Your Findings: Summarize insights, model performance, and actionable recommendations clearly.
Data Science With Python Example: Customer Churn
Customer churn is a useful example for understanding how different Python skills can come together in a data science workflow.
Note: The example below describes an illustrative workflow. The numerical results should not be treated as findings from a real dataset unless they are calculated from a documented dataset and reproducible analysis.
Problem Statement
Suppose a subscription business wants to identify customers who may be at higher risk of cancelling their subscriptions.
The objective is to use historical customer data to understand factors associated with churn and, if appropriate, develop a model that can identify higher-risk customers.
Example Dataset
The dataset could contain variables such as:
Customer tenure
Monthly spending
Number of support interactions
Subscription type
Contract length
Churn status
The churn column would act as the target variable for a supervised classification problem.
Load the Data
Pandas can be used to load the dataset and inspect its structure.
import pandas as pd

df = pd.read_csv("customer_churn.csv")

print(df.head())
print(df.info())
print(df.isnull().sum())
The first step is not to immediately train a model. Inspect the data to understand its structure, data types, missing values, and potential quality problems.
Clean and Prepare the Data
Depending on the dataset, preprocessing may involve:
Handling missing values
Removing or investigating duplicate records
Converting categorical variables into usable features
Checking unusual values
Separating features from the target
Splitting the data into training and test sets
The appropriate preprocessing method should depend on the characteristics of the dataset.
Explore the Data
Before building a model, investigate questions such as:
Does churn vary by subscription type?
Is churn associated with customer tenure?
How does spending differ between churned and retained customers?
Are customers with more support interactions more likely to churn?
Visualizations and summary statistics can help identify relationships that are worth investigating.
Build a Machine Learning Model
A simple classification model can be used as a baseline. For example, Scikit-learn's Random Forest classifier can be trained on the prepared training data.
from sklearn.ensemble import RandomForestClassifier

model = RandomForestClassifier(
    n_estimators=100,
    random_state=42
)

model.fit(X_train, y_train)

predictions = model.predict(X_test)
Evaluate the Model
The model should be evaluated using data that was not used during training.
For a churn classification problem, useful metrics can include:
Precision
Recall
F1-score
ROC-AUC
Accuracy can also be reported, but it should not be the only metric considered, particularly when the classes are imbalanced.
Interpret the Results
The final stage is to translate the analysis into useful conclusions.
A strong project should distinguish between:
Patterns observed in the data
Predictions made by the model
Assumptions made during analysis
Limitations of the dataset
Potential business actions
Importantly, a correlation or model prediction does not automatically establish that one factor causes customer churn.
What This Project Demonstrates
A well-structured churn project can demonstrate practical skills in:
Python programming
Pandas
Data cleaning
Exploratory data analysis
Data visualization
Feature preparation
Machine learning
Model evaluation
Business communication
This makes the project more valuable as a learning exercise and portfolio piece than simply reporting a model accuracy score.
Python for Data Science, AI, and Machine Learning
Python for Data Science: Focuses on historical data extraction, statistical analysis, and business reporting.
Python for Machine Learning: Focuses on predictive algorithm development and automated decision logic.
Python for Artificial Intelligence: Focuses on deep learning, natural language processing, computer vision, and cognitive systems.
Python for Deep Learning: Uses multi-layer neural networks via PyTorch and TensorFlow for complex data formats like imagery and audio.
Python's Role in the AI Ecosystem: Python serves as the primary language across academic research and enterprise production. This scope is reflected in global training standards like the python for data science ai & development program, proving Python's central role across modern computing.
Data Science With Python Learning Path
Learn Python Fundamentals: Master variables, data structures, conditional logic, loops, and modular functions.
Learn SQL and Databases: Practice database queries using SELECT, JOIN, GROUP BY, and window functions.
Learn NumPy and Pandas: Gain speed in manipulating DataFrames and applying vector array math.
Learn Statistics: Understand probability distributions, central limit theorem, hypothesis testing, and regression metrics.
Learn Data Visualization: Master static and interactive charting libraries to present data effectively.
Learn Machine Learning: Understand core algorithms, feature scaling, and evaluation metrics.
Build Real-World Projects: Apply your knowledge to unguided datasets to solve end-to-end analytical problems.
Build a Data Science Portfolio: Publish clean code repositories and live web apps on GitHub to showcase your technical capability to employers.
Common Challenges When Learning Data Science With Python
Learning Python and Statistics Together: Balance daily syntax exercises with conceptual statistical learning to avoid cognitive fatigue.
Working With Messy Real-World Data: Real enterprise datasets require significant cleaning time, unlike clean tutorial CSV files.
Understanding Machine Learning Concepts: Focus first on practical algorithm applications and output interpretation before diving into deep mathematical proofs.
Moving From Tutorials to Projects: Transition from following tutorial guides to analyzing open datasets independently without provided solutions.
Building Job-Ready Skills: Focus on end-to-end projects that solve genuine business problems rather than re-running generic toy datasets. Completing structured coursework aligned with a realistic data science using python syllabus helps bridge the gap between basic syntax and professional deployment in data science in 2026.
Frequently Asked Questions
How Can I Learn Data Science With Python?
Start with Python fundamentals, then learn NumPy, Pandas, visualization, statistics, and machine learning. Apply each skill through practical projects using real datasets.
Why Is Python Used in Data Science?
Python is easy to learn and has a large ecosystem of libraries for data analysis, visualization, statistics, machine learning, and AI.
How Much Python Do I Need to Know for Data Science?
Learn variables, data types, conditions, loops, functions, data structures, file handling, and basic debugging. You can learn advanced Python as your projects become more complex.
Is R or Python Better for Data Science?
Neither is universally better. Python is highly versatile for data science, machine learning, AI, and automation, while R is particularly strong for statistical analysis and research.
Is Python Necessary for Data Science?
No. Data science can also involve R, SQL, Julia, and other technologies. However, Python is widely used and is a valuable skill for data analysis, machine learning, and AI.
What Is Python Used for in Data Science?
Python is used for data collection, cleaning, analysis, visualization, machine learning, automation, and AI. Libraries such as Pandas, NumPy, Matplotlib, Seaborn, and Scikit-learn support these tasks.